Logging with Elasticsearch and Kibana
On the Google Compute Engine (GCE) platform the default cluster level logging support targets Google Cloud Logging as described at the Logging getting started page. Here we describe how to set up a cluster to ingest logs into Elasticsearch and view them using Kibana as an alternative to Google Cloud Logging.
To use Elasticsearch and Kibana for cluster logging you should set the following environment variable as shown below:
KUBE_LOGGING_DESTINATION=elasticsearch
You should also ensure that KUBE_ENABLE_NODE_LOGGING=true (which is the default for the GCE platform).
Now when you create a cluster a message will indicate that the Fluentd node-level log collectors will target Elasticsearch:
$ cluster/kube-up.sh
...
Project: kubernetes-satnam
Zone: us-central1-b
... calling kube-up
Project: kubernetes-satnam
Zone: us-central1-b
+++ Staging server tars to Google Storage: gs://kubernetes-staging-e6d0e81793/devel
+++ kubernetes-server-linux-amd64.tar.gz uploaded (sha1 = 6987c098277871b6d69623141276924ab687f89d)
+++ kubernetes-salt.tar.gz uploaded (sha1 = bdfc83ed6b60fa9e3bff9004b542cfc643464cd0)
Looking for already existing resources
Starting master and configuring firewalls
Created [https://www.googleapis.com/compute/v1/projects/kubernetes-satnam/zones/us-central1-b/disks/kubernetes-master-pd].
NAME                 ZONE          SIZE_GB TYPE   STATUS
kubernetes-master-pd us-central1-b 20      pd-ssd READY
Created [https://www.googleapis.com/compute/v1/projects/kubernetes-satnam/regions/us-central1/addresses/kubernetes-master-ip].
+++ Logging using Fluentd to elasticsearch
The node level Fluentd collector pods and the Elasticsearech pods used to ingest cluster logs and the pod for the Kibana viewer should be running in the kube-system namespace soon after the cluster comes to life.
$ kubectl get pods --namespace=kube-system
NAME                                           READY     REASON    RESTARTS   AGE
elasticsearch-logging-v1-78nog                 1/1       Running   0          2h
elasticsearch-logging-v1-nj2nb                 1/1       Running   0          2h
fluentd-elasticsearch-kubernetes-node-5oq0     1/1       Running   0          2h
fluentd-elasticsearch-kubernetes-node-6896     1/1       Running   0          2h
fluentd-elasticsearch-kubernetes-node-l1ds     1/1       Running   0          2h
fluentd-elasticsearch-kubernetes-node-lz9j     1/1       Running   0          2h
kibana-logging-v1-bhpo8                        1/1       Running   0          2h
kube-dns-v3-7r1l9                              3/3       Running   0          2h
monitoring-heapster-v4-yl332                   1/1       Running   1          2h
monitoring-influx-grafana-v1-o79xf             2/2       Running   0          2h
Here we see that for a four node cluster there is a fluent-elasticsearch pod running which gathers
the Docker container logs and sends them to Elasticsearch. The Fluentd collector communicates to
a Kubernetes service that maps requests to specific Elasticsearch pods. Similarly, Kibana can also be
accessed via a Kubernetes service definition.
$ kubectl get services --namespace=kube-system
NAME                    LABELS                                                                                              SELECTOR                        IP(S)          PORT(S)
elasticsearch-logging   k8s-app=elasticsearch-logging,kubernetes.io/cluster-service=true,kubernetes.io/name=Elasticsearch   k8s-app=elasticsearch-logging   10.0.222.57    9200/TCP
kibana-logging          k8s-app=kibana-logging,kubernetes.io/cluster-service=true,kubernetes.io/name=Kibana                 k8s-app=kibana-logging          10.0.193.226   5601/TCP
kube-dns                k8s-app=kube-dns,kubernetes.io/cluster-service=true,kubernetes.io/name=KubeDNS                      k8s-app=kube-dns                10.0.0.10      53/UDP
                                                                                                                                                                           53/TCP
kubernetes              component=apiserver,provider=kubernetes                                                             <none>                          10.0.0.1       443/TCP
monitoring-grafana      kubernetes.io/cluster-service=true,kubernetes.io/name=Grafana                                       k8s-app=influxGrafana           10.0.167.139   80/TCP
monitoring-heapster     kubernetes.io/cluster-service=true,kubernetes.io/name=Heapster                                      k8s-app=heapster                10.0.208.221   80/TCP
monitoring-influxdb     kubernetes.io/cluster-service=true,kubernetes.io/name=InfluxDB                                      k8s-app=influxGrafana           10.0.188.57    8083/TCP
By default two Elasticsearch replicas are created and one Kibana replica is created.
$ kubectl get rc --namespace=kube-system
CONTROLLER                     CONTAINER(S)            IMAGE(S)                                          SELECTOR                                   REPLICAS
elasticsearch-logging-v1       elasticsearch-logging   gcr.io/google_containers/elasticsearch:1.4        k8s-app=elasticsearch-logging,version=v1   2
kibana-logging-v1              kibana-logging          gcr.io/google_containers/kibana:1.3               k8s-app=kibana-logging,version=v1          1
kube-dns-v3                    etcd                    gcr.io/google_containers/etcd:2.0.9               k8s-app=kube-dns,version=v3                1
                               kube2sky                gcr.io/google_containers/kube2sky:1.9
                               skydns                  gcr.io/google_containers/skydns:2015-03-11-001
monitoring-heapster-v4         heapster                gcr.io/google_containers/heapster:v0.14.3         k8s-app=heapster,version=v4                1
monitoring-influx-grafana-v1   influxdb                gcr.io/google_containers/heapster_influxdb:v0.3   k8s-app=influxGrafana,version=v1           1
                               grafana                 gcr.io/google_containers/heapster_grafana:v0.7
The Elasticsearch and Kibana services are not directly exposed via a publicly reachable IP address. Instead,
they can be accessed via the service proxy running at the master. The URLs for accessing Elasticsearch
and Kibana via the service proxy can be found using the kubectl cluster-info command.
$ kubectl cluster-info
Kubernetes master is running at https://146.148.94.154
Elasticsearch is running at https://146.148.94.154/api/v1/proxy/namespaces/kube-system/services/elasticsearch-logging
Kibana is running at https://146.148.94.154/api/v1/proxy/namespaces/kube-system/services/kibana-logging
KubeDNS is running at https://146.148.94.154/api/v1/proxy/namespaces/kube-system/services/kube-dns
KubeUI is running at https://146.148.94.154/api/v1/proxy/namespaces/kube-system/services/kube-ui
Grafana is running at https://146.148.94.154/api/v1/proxy/namespaces/kube-system/services/monitoring-grafana
Heapster is running at https://146.148.94.154/api/v1/proxy/namespaces/kube-system/services/monitoring-heapster
InfluxDB is running at https://146.148.94.154/api/v1/proxy/namespaces/kube-system/services/monitoring-influxdb
Before accessing the logs ingested into Elasticsearch using a browser and the service proxy URL we need to find out
the admin password for the cluster using kubectl config view.
$ kubectl config view
...
- name: kubernetes-satnam_kubernetes-basic-auth
  user:
    password: 7GlspJ9Q43OnGIJO
    username: admin
...
The first time you try to access the cluster from a browser a dialog box appears asking for the username and password.
Use the username admin and provide the basic auth password reported by kubectl config view for the
cluster you are trying to connect to. Connecting to the Elasticsearch URL should then give the
status page for Elasticsearch.
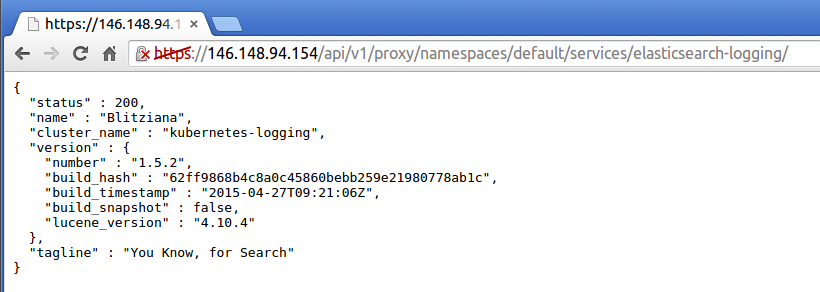
You can now type Elasticsearch queries directly into the browser. Alternatively you can query Elasticsearch
from your local machine using curl but first you need to know what your bearer token is:
$ kubectl config view --minify
apiVersion: v1
clusters:
- cluster:
    certificate-authority-data: REDACTED
    server: https://146.148.94.154
  name: kubernetes-satnam_kubernetes
contexts:
- context:
    cluster: kubernetes-satnam_kubernetes
    user: kubernetes-satnam_kubernetes
  name: kubernetes-satnam_kubernetes
current-context: kubernetes-satnam_kubernetes
kind: Config
preferences: {}
users:
- name: kubernetes-satnam_kubernetes
  user:
    client-certificate-data: REDACTED
    client-key-data: REDACTED
    token: JsUe2Z3cXqa17UQqQ8qWGGf4nOSLwSnp
Now you can issue requests to Elasticsearch:
$ curl --header "Authorization: Bearer JsUe2Z3cXqa17UQqQ8qWGGf4nOSLwSnp" --insecure https://146.148.94.154/api/v1/proxy/namespaces/kube-system/services/elasticsearch-logging/
{
  "status" : 200,
  "name" : "Vance Astrovik",
  "cluster_name" : "kubernetes-logging",
  "version" : {
    "number" : "1.5.2",
    "build_hash" : "62ff9868b4c8a0c45860bebb259e21980778ab1c",
    "build_timestamp" : "2015-04-27T09:21:06Z",
    "build_snapshot" : false,
    "lucene_version" : "4.10.4"
  },
  "tagline" : "You Know, for Search"
}
Note that you need the trailing slash at the end of the service proxy URL. Here is an example of a search:
$ curl --header "Authorization: Bearer JsUe2Z3cXqa17UQqQ8qWGGf4nOSLwSnp" --insecure https://146.148.94.154/api/v1/proxy/namespaces/kube-system/services/elasticsearch-logging/_search?pretty=true
{
  "took" : 7,
  "timed_out" : false,
  "_shards" : {
    "total" : 6,
    "successful" : 6,
    "failed" : 0
  },
  "hits" : {
    "total" : 123711,
    "max_score" : 1.0,
    "hits" : [ {
      "_index" : ".kibana",
      "_type" : "config",
      "_id" : "4.0.2",
      "_score" : 1.0,
      "_source":{"buildNum":6004,"defaultIndex":"logstash-*"}
    }, {
...
      "_index" : "logstash-2015.06.22",
      "_type" : "fluentd",
      "_id" : "AU4c_GvFZL5p_gZ8dxtx",
      "_score" : 1.0,
      "_source":{"log":"synthetic-logger-10lps-pod: 31: 2015-06-22 20:35:33.597918073+00:00\n","stream":"stdout","tag":"kubernetes.synthetic-logger-10lps-pod_default_synth-lgr","@timestamp":"2015-06-22T20:35:33+00:00"}
    }, {
      "_index" : "logstash-2015.06.22",
      "_type" : "fluentd",
      "_id" : "AU4c_GvFZL5p_gZ8dxt2",
      "_score" : 1.0,
      "_source":{"log":"synthetic-logger-10lps-pod: 36: 2015-06-22 20:35:34.108780133+00:00\n","stream":"stdout","tag":"kubernetes.synthetic-logger-10lps-pod_default_synth-lgr","@timestamp":"2015-06-22T20:35:34+00:00"}
    } ]
  }
}
The Elasticsearch website contains information about URI search queries which can be used to extract the required logs.
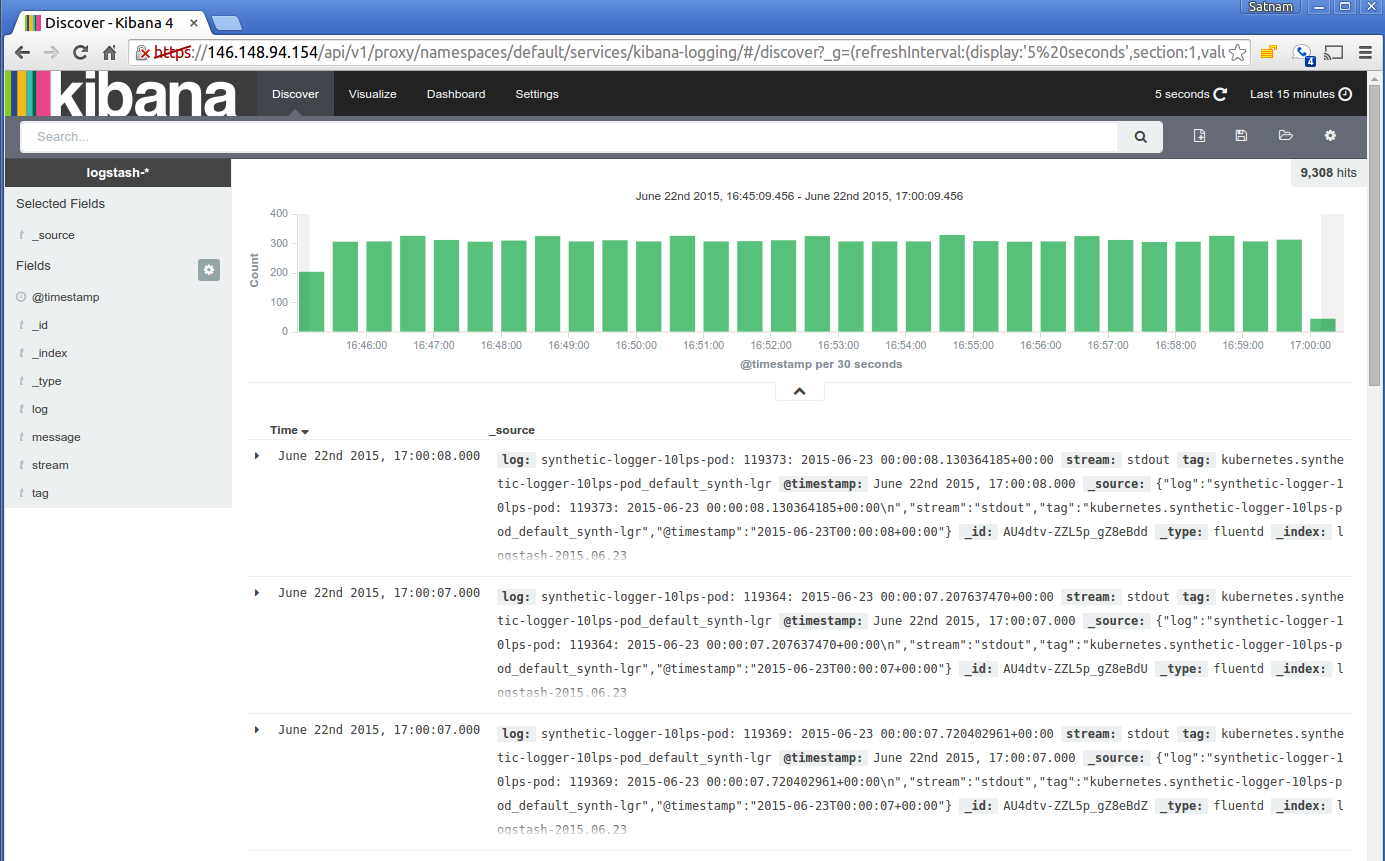
Alternatively you can view the ingested logs using Kibana. The first time you visit the Kibana URL you will be
presented with a page that asks you to configure your view of the ingested logs. Select the option for
timeseries values and select @timestamp. On the following page select the Discover tab and then you
should be able to see the ingested logs. You can set the refresh interval to 5 seconds to have the logs
regulary refreshed. Here is a typical view of ingested logs from the Kibana viewer.
Another way to access Elasticsearch and Kibana in the cluster is to use kubectl proxy which will serve
a local proxy to the remote master:
$ kubectl proxy
Starting to serve on localhost:8001
Now you can visit the URL http://localhost:8001/api/v1/proxy/namespaces/kube-system/services/elasticsearch-logging to contact Elasticsearch and http://localhost:8001/api/v1/proxy/namespaces/kube-system/services/kibana-logging to access the Kibana viewer.